
For the fundable entrepreneur and company, there is an investor at every company stage. If you are the CEO, when it comes time to fundraise, it’s your job to find and secure meetings with the right investors for your market, stage, business model, and thesis.
It makes no sense to talk with an investor who is not a fit. Here’s the funding continuum, showing the relationship between investor class and value inflection points:
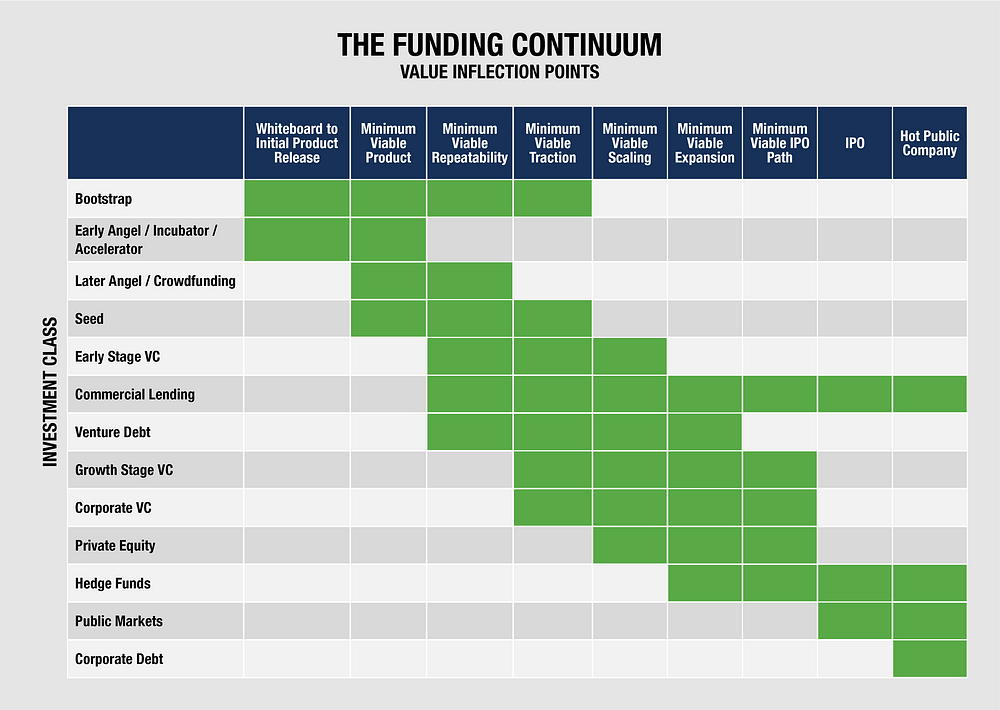
Funding can come from either debt or equity. As to the former, commercial lending becomes viable once your accounts receivable reaches a minimum threshold and your company has enough liquidation value to mitigate term loan risk. Commercial lending options widen as you scale. Venture debt becomes viable once you can raise significant venture equity; venture debt usually rides alongside equity investments. Once you’re a public company, you can issue corporate debt.
As to equity investments, there is an investor class for every company milestone — marked by the value inflection points. At each milestone the amount of investable external capital grows, while the number of investment worthy companies declines. 30 million small businesses exist in the United States. 800,000 new ones launch every year. The vast majority of these new businesses are bootstrapped. A small percentage of these companies — mostly tech companies — will seek angel and seed stage investments from outside investors.
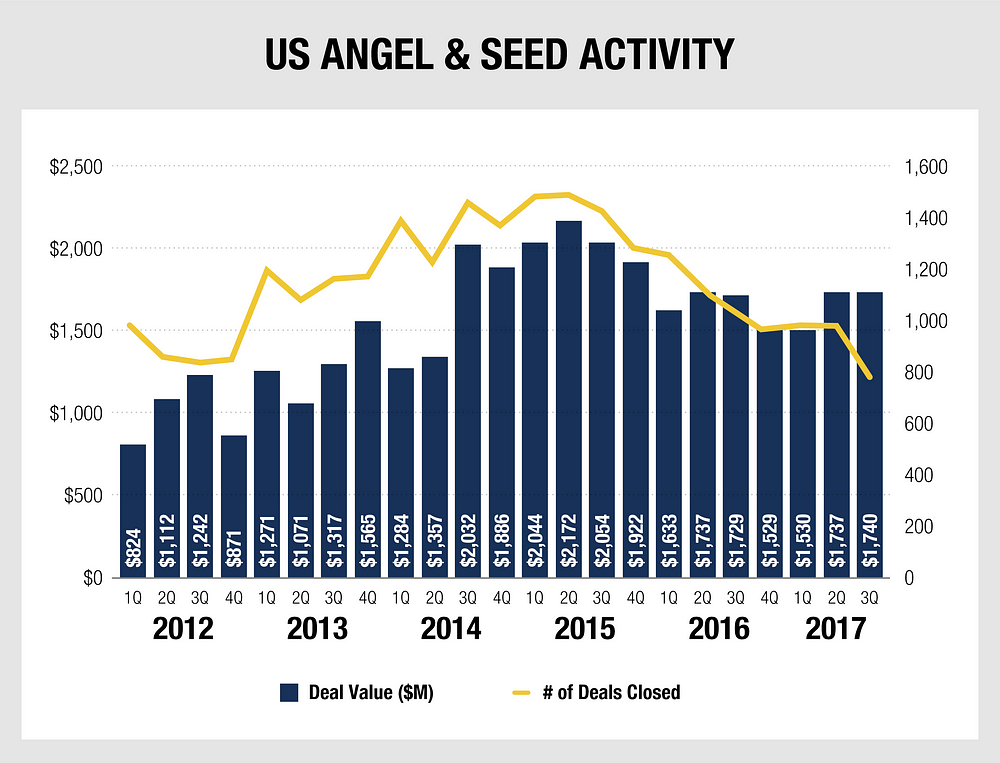
Angel and seed stage investments have grown significantly in recent years. Between 2010 and 2015, angel and seed stage deal count grew 230%.¹ In recent years, the amount invested in the US at the angel and seed stages has remained consistent at about $6B per year. At this stage, investments can range from tens of thousands of dollars up to a couple of million. The rising popularity of crowdfunding sites such as AngelList, SeedInvest and MicroVentures, along with the rise in incubators and accelerators, have increased angel stage funding opportunities.
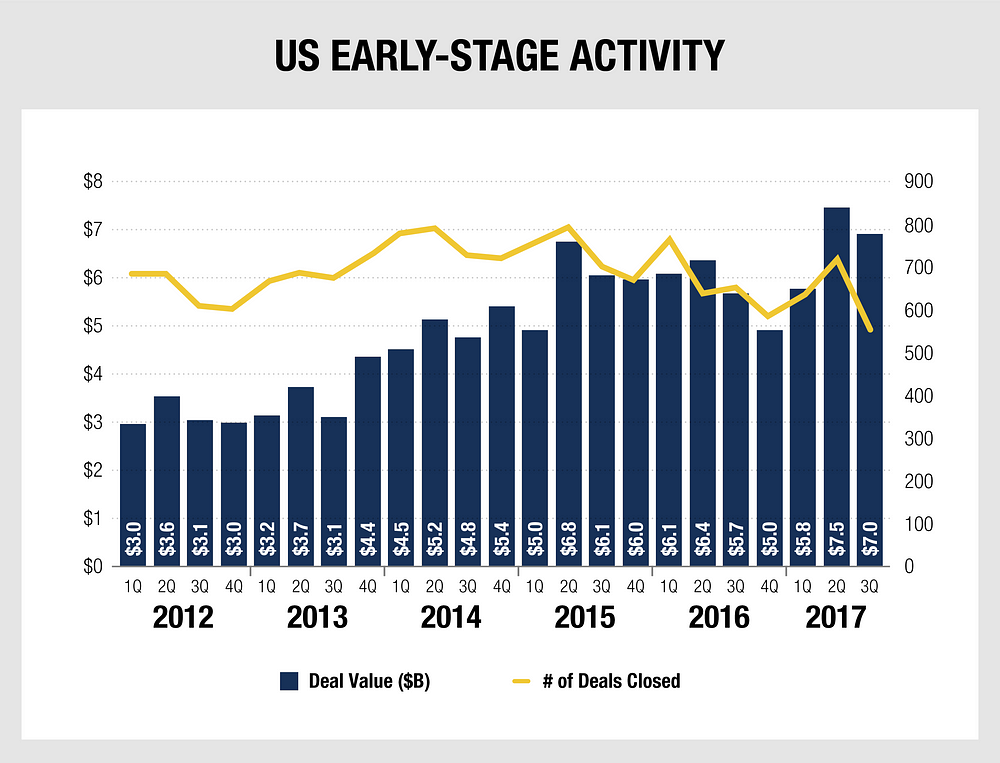
A small minority of new companies scale to the point where they become worthy of early stage VC investment. In the US, about $24B a year is invested by early stage VCs. The median early stage VC investment hovers in the $5M range.²
If your company is one of the few that achieves sufficient traction, you can eventually tap into growth stage VC investing. Here, the check size tends to be larger — in the $10M to $25M range. Even further along the scaling path, late stage VC investment becomes viable. In recent years, between $40B and $50B in late stage investments have been made. Much of this money — about half of it in 2017 — has been dedicated to unicorn investments with check sizes of $100M or more per company. Two-thirds has been invested with check sizes of over $50M per company.
As a company continues to scale, the private equity exit becomes a viable path. Data shown on the research platform Statista indicates that in 2017, about $1 trillion in funds were available for private equity investments worldwide (this is PE firms’ liquid assets, often called “dry powder”). In the US alone, private equity firms raise about $140B a year in new funding.
For the most successful later stage companies, hedge fund investors comprise a viable source of funding. Hedge funds invest in both the public markets and late stage private companies. Worldwide, hedge funds have $3 trillion in assets under management.
The final equity investor class in the investor continuum is the public markets. Each year, a few companies enter the public markets (160 in the US last year). As of early 2018, the market capitalization of all US public stocks is about $25 trillion.
Bootstrap
Of those 800,000 startups that launch each year in the US, most are bootstrapped. By this we mean the company has been built via some mix of self-funding, family and friends funding, and sweat equity.
It’s possible that a company can be built solely through sweat equity. With time, a couple of talented programmers working for no pay might create a game or a mobile app, or a consumer site, or a light business application that gains traction with very little cash required. But most businesses require at least some funding to get off the ground.
Except for the rare example of the rich serial entrepreneur, bootstrap funding usually totals well under $200,000. This is an unusual investment class, because it’s not motivated strictly by risk and return. When you fund your own business, you are both the investor and the entrepreneur. When a friend or family member invests in your business, the heart may play a bigger role than the head. At best, these investments are very risky: statistically, there is a reasonable likelihood they will yield zero returned cash.
Early Angel: Incubators and Accelerators
The early stage investor makes a high-risk bet. The failure rate is high for companies who have not yet launched an initial product, or who don’t yet have proof that the product has achieved minimum viability. The rational early stage investor places many bets, hoping to bet on one needle with a 100X return in a haystack of investments. Early angel investors understand that even in a successful company, capital may be tied up for 10 years or more.
One way for early angel investors to de-risk their investments is to ensure startup teams have maximum support and mentoring in their earliest stages of development. Incubators and accelerators have emerged to support entrepreneurs through this stage of the scaling journey. In some programs, if you are accepted, an investment is directly made in your company. In other programs, the cost of space and services is absorbed, mentoring and coaching services are offered, and warm introductions are made to angel investors.
Later Angel / Crowdfunding
The National Venture Capital Association recorded about 3800 angel and seed deals between Q4 2016 and Q3 2017, comprising about $6.5B in invested capital.³
The later angel investor seeks 50X or greater returns, recognizing that the investment failure rate will be very high. Most investors at this stage expect to be actively involved with the company as mentor and supporter. The investment time horizon is expected to be 7–10 years.
Seed / Seed Plus
Angel and seed stage investments tend to be grouped together as one investment class in data analytics, but they are different. A seed stage investment is usually made after initial product release, and after the company has achieved indications that they have a Minimum Viable Product. Seed investments fund the company’s pursuit of Minimum Viable Repeatability, which is the critical proof point required to raise an early stage VC round. Most seed investments run in the range of $500K to $2M. Usually there is just one seed round, but a second round — “seed plus” — is not uncommon in the lead-up to a VC-led “A” round.
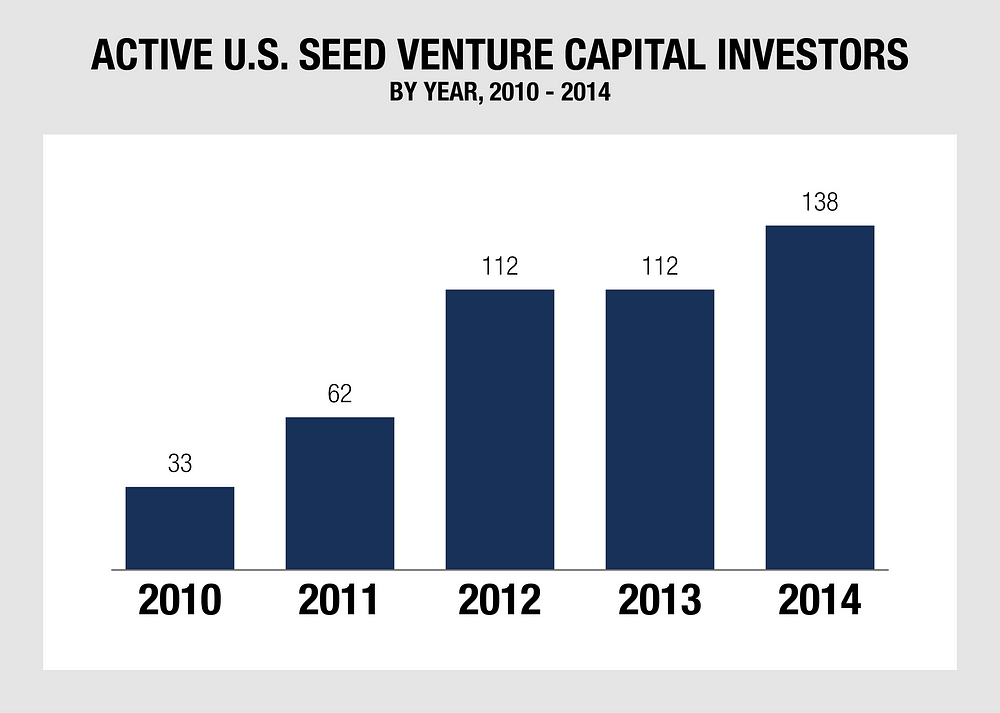
Seed investments have been on the rise, due in no small part to the emergence of micro VC funds. In 2014 (the most recent data available), 138 US funds made at least four seed investments.⁴
Seed investors seek 30X returns, and expect that capital will be tied up for about 8 years on average. Such investors expect to be actively involved in mentoring and support, especially during the time leading up to the A round.
Early stage VC
Early stage VCs invest once there is some signal of product / market fit. This is usually at the “Minimum Viable Repeatability” value inflection point,when there is early proof that customers can be acquired with consistency. The early stage VC expects to have its capital tied up in an investment for about seven years. Early stage VCs seek 10X returns from their investments.
From Q4 2016 through Q3 2017, $25.3B of early-stage venture investments were made:⁵
Commercial banking
An important investment class in the funding continuum is the commercial bank. A commercial bank provides both deposit services and lending. As a tech company CEO, once you have built up your customer count and have a monthly accounts receivable balance, you can secure an AR line. In an AR line, the bank lends a percentage of outstanding accounts receivable as working capital, in effect providing you about a month of additional runway. And if your company has gained sufficient scale, is showing traction, and has solid prospects, you may also be able to secure a term loan. It is not unusual for a tech company which has achieved $3M or more in revenue run rate to be eligible for a term loan in the $1M — $3M range, with moderate interest rates tied to the prime rate. As a company scales, the size of the term loan can grow.
Venture debt
For the tech company CEO, venture debt is an attractive and underutilized investment class. Venture debt offers you the opportunity to reduce the dilution you would face if you raised all your cash via equity investments. A venture debt investment is provided at a much higher interest rate — often in the 12% range. Companies must also issue warrants to the debt provider in most cases. As a rule of thumb, venture debt providers are willing to loan between ⅓ and ½ of a venture equity round in additional venture debt.
Growth stage VC
The growth stage investor invests once a startup has achieved Minimum Viable Traction. At this stage, there is solid proof of product / market fit, as shown in the performance of the company’s revenue engine. The growth stage investor may come in at the A, B or C+ round. Growth stage VCs tend to have large funds — $300M or more — and write bigger checks than early stage VCs. An early stage VC might write a $3M — $6M check, whereas the check from a growth stage VC might be $10M — $20M. Investors seek 5X returns at this stage, and expect that their money will be tied up for about five years.
Corporate VC
In 2017, $31.2B was invested worldwide by corporate venture capital entities. $18.8B of corporate VC investments were made in the US alone. The average investment was $22M.
Here is the pace of US investments, according to the 2017 Global Corporate Venture Capital Report from CB Insights:⁶
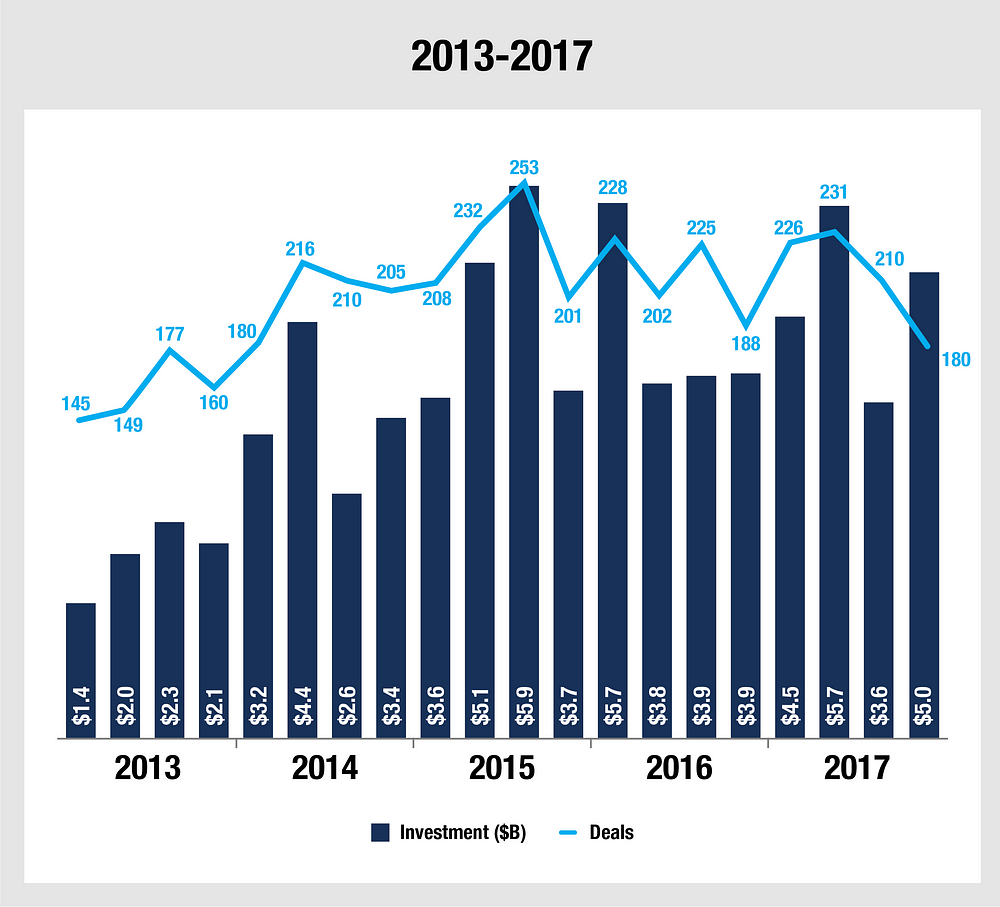
There is much diversity in the corporate venture world. Some venture funds, such as Microsoft Ventures and Google Ventures, operate without restriction, similar to an independent growth stage VC. Others provide strict investment guidelines tied to strategic corporate objectives and require that these investments ride along with an investment from an independent VC.
Late stage VC
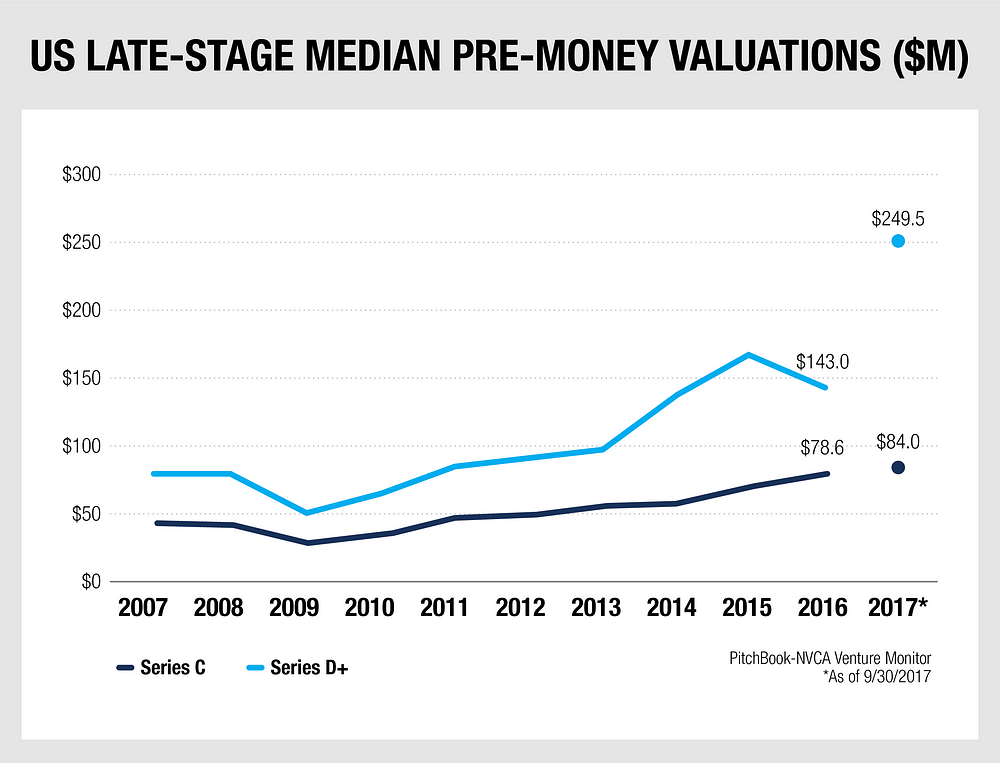
$43.6B in late stage VC investment occurred between Q4 2016 and Q3 2017.⁷
Late stage VC investments are made in companies who have achieved Minimum Viable scaling all the way through the IPO path. At this stage of investment, check sizes can range from $50M to hundreds of millions of dollars; pre-money valuations are often in the $100M+ range:⁸
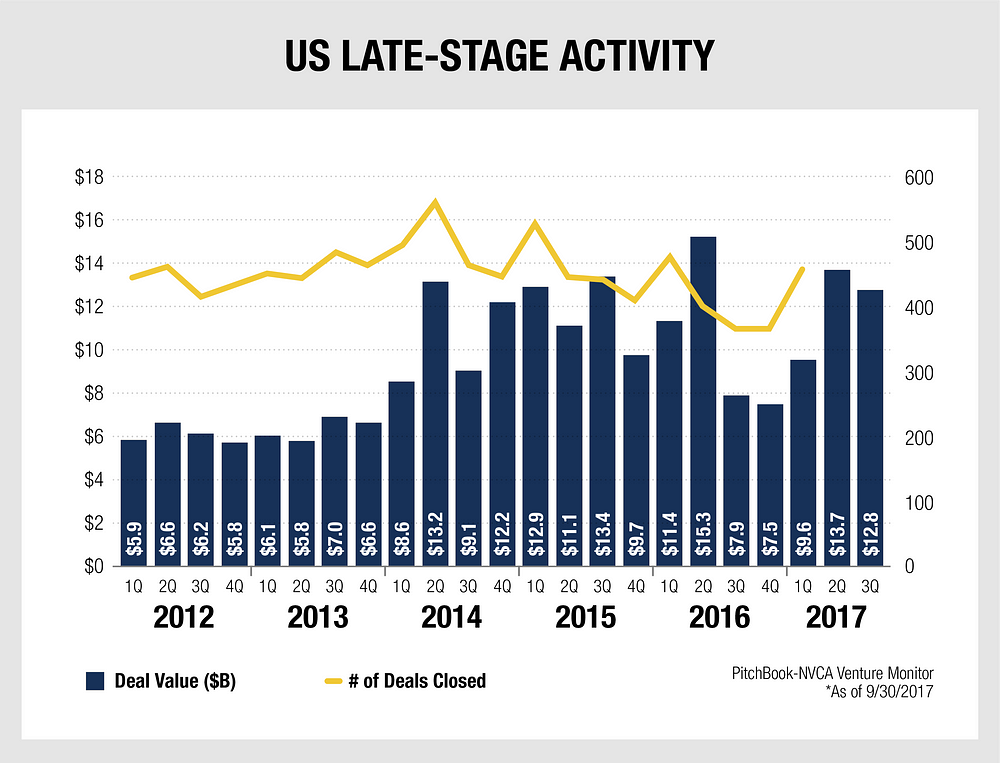
The late stage VC investor seeks 2X returns.
Private equity
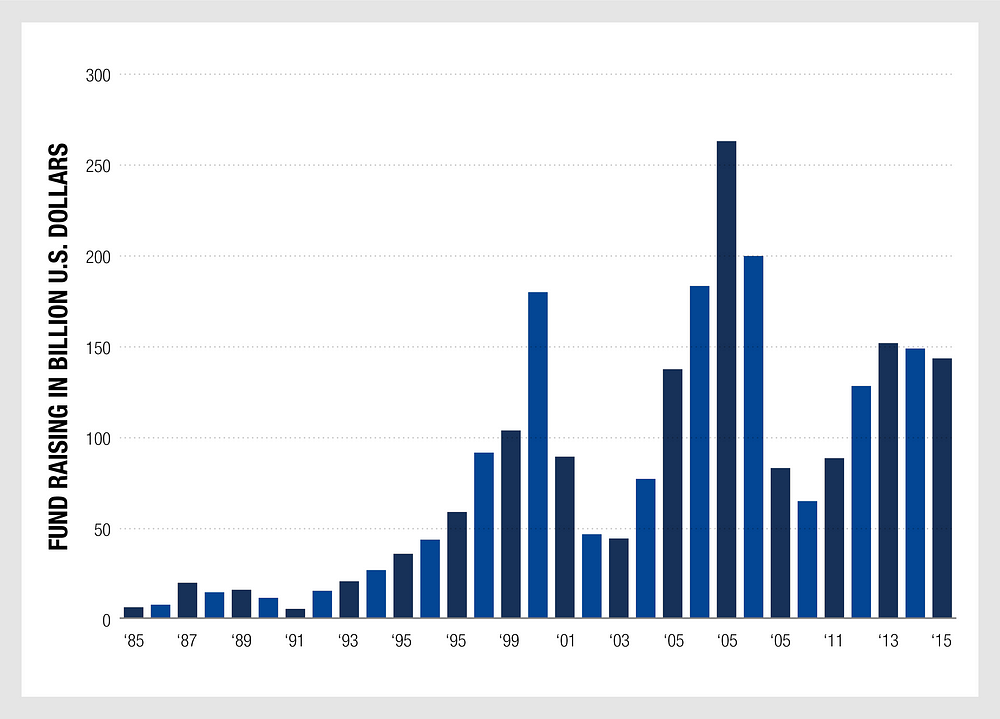
Despite the formidable size of the venture capital industry, it pales in comparison to the size of the private equity industry, which has $1 trillion in current investments. In 2016, private equity investors placed $148 billion in tech, up from $43 billion in 2015. Private equity not only makes up four times the amount of VC investment in the U.S. annually, but also provides access to the deep capital reserves needed for maturing tech companies to scale. Although going public has long been the mother of all post-VC exits, that strategy has fallen out of favor with companies that no longer wish to play the quarterly earnings game, nor combat regulatory requirements lest Wall Street’s ridiculously high bar for market cap and scale. Instead, it is rather important for most companies in tech to have the ability to experiment with product advancements, new growth avenues, and revenue streams out of the purview of the public markets, which struggle to view failure as a necessary component of innovation.
Fundraising of private equity companies in the United States from 1985 to 2015 (in billion US dollars)⁹
Hedge funds
Hedge funds play an increasingly important role in the public and private markets, contributing $3 trillion in assets under management. A large portion of these funds are focused on public equities. Hedge funds aggregate assets from institutional investors with significant cash to deploy, such as pension funds, sovereign wealth funds, and labor unions.
The investment model for hedge funds targets annual returns of 6 to 8%. Returns are usually amplified with debt leverage. Hedge funds which use higher leverage generate higher returns with commensurately higher risk and volatility. Leverage also enables these funds to take much larger positions in an investment than would otherwise be possible.
The Public Market
The public market is huge. The worldwide stock market is $80 trillion, with $20 trillion in the U.S. alone. This market is made up of a variety of investors. Individual households own 33% of the total market value. They are followed by mutual funds (20%), international investors (15%), pension funds (15%), hedge funds (5%), and exchange traded funds or ETFs (5%).
Because of its size, the public market delivers investors liquidity. For example, over 30 million shares of Apple stock change hands each day, consistent with its roughly $800 billion market capitalization. Investors in the public market expect to be able to buy and sell on demand, and every day of the year the market delivers.
Most public market investors are fundamental investors. These investors perform bottoms up market analysis encompassing business financials, health, competition, growth, and market opportunity, all relative to the company’s current valuation on the open market. Fundamental stock market investors typically buy and hold for 6 to 18 months and look for returns in the 8 to 10% range each year. Technical and quantitative investors (which disregard fundamentals and instead focus on quantitative trading metrics to find advantage) are a smaller, but fast growing, part of the investment class.
Corporate Bonds
The $10 trillion corporate bond market isan important funding alternative once a company goes public.
Corporate bonds are simply bonds issued by corporations to fund their operations. A company that wants to raise cash can either sell equity by issuing stock or take on debt by issuing bonds. Investors, who act as lenders, typically evaluate corporate bonds by looking at their yield advantage relative to U.S. Treasuries. For instance, if 10-year U.S. Treasury notes are yielding 2% annually versus 3.75% for a corporate bond, the yield spread would be 1.75%, meaning the investor would be earning 1.75% more annually by investing in a corporate bond rather than a Treasury note.
Corporations that are financially strong and have massive amounts of cash on their balance sheets, such as Microsoft and Apple, can typically offer bonds with lower yields, since investors are confident that the companies won’t default or miss interest or principal payments. These bonds are referred to as high-grade bonds. Conversely, lower-rated companies — those with higher debt or businesses that produce unreliable cash flows — must offer higher yields to entice investors to purchase their bonds. These are sometimes referred to as “high-yield” or “junk” bonds. In the current low interest rate environment, the expected return on corporate bonds is roughly 4% annually.
Investors in corporate bonds include individual households, which participate via mutual funds, plus insurance companies, pension funds, sovereign wealth funds and other large institutions. The investor plays a passive role in the investment, with no influence over corporate actions outside of the case of a bankruptcy proceeding, in which the bondholder has preferential rights.
. . .
Notes
1. PitchBook Data, Inc. and National Venture Capital Association, “Venture Monitor | 3Q 2017”, 2017, 8.
2. Ibid, 9.
3. Ibid, 8.
4. “The 106 Most Active Seed Venture Capital Firms”, CB Insights, 2015, https://www.cbinsights.com/research/active-seed-venture-capital-firms-2014/.
5. PitchBook Data, Inc. and National Venture Capital Association, “Venture Monitor | 3Q 2017”, 2017, 9.
6. “The 2017 Global CVC Report”, CB Insights, https://www.cbinsights.com/research/report/corporate-venture-capital-trends-2017/.
7. PitchBook Data, Inc. and National Venture Capital Association, “Venture Monitor | 3Q 2017”, 2017, 10.
8. Ibid.
9. “Fundraising Of Private Equity Companies In The United States From 1985 to 2015 (In Billion US Dollars) | Statistic”, Statista, 2018, https://www.statista.com/statistics/280255/private-equity-fund-raising-of-holdings-in-the-united-states/.
. . .
To view all chapters go here.
If you would like more CEO insights into scaling your revenue engine and building a high-growth tech company, please visit us at CEOQuest.com, and follow us on LinkedIn, Twitter, and YouTube.