
Unicorns became unicorns via unit economics.
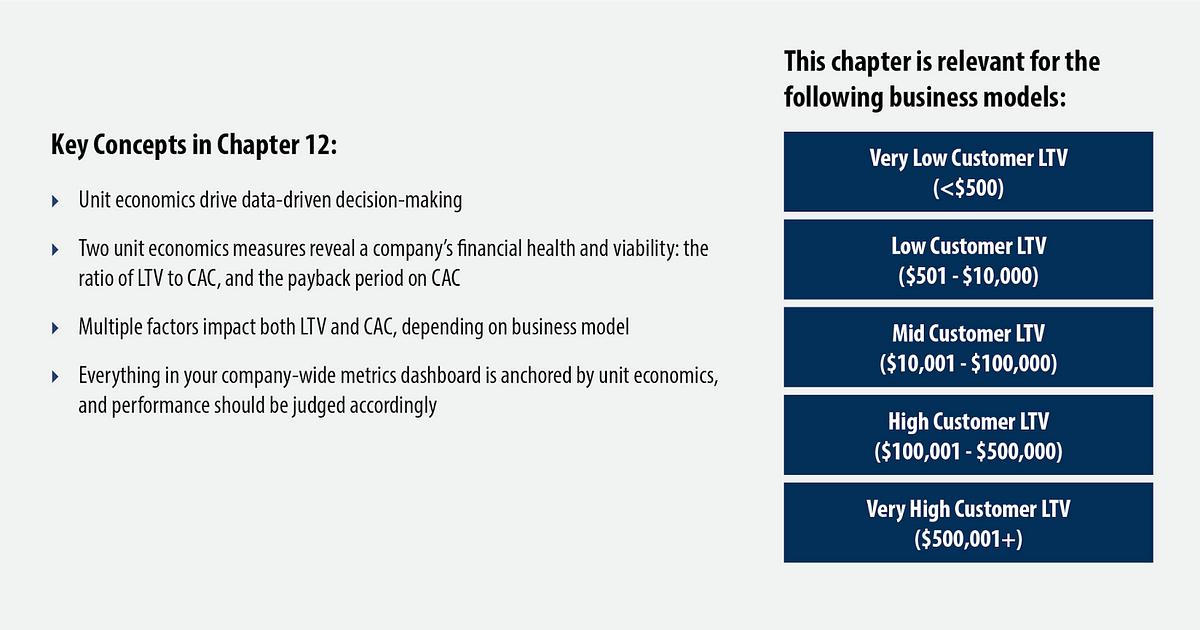
Data-driven decision-making is key to a fit and trim revenue engine. Your metrics dashboard is your window into engine performance, giving you the necessary visibility and intelligence to see problems and fix them. So it’s important to design your metrics infrastructure so that your unit economics are clear. Unit economics pair with the financial plan to comprise the second foundational layer of the revenue engine.
Metrics exist to point you towards maximum profitability and growth. Depending on the business model and other factors, your metrics may assess profitability and growth by:
- Segment
- Product
- Channel
- Marketing program / campaign
- Sales region
- Salesperson
Of course, if you have a Very Low LTV (<$500) business model, metrics exclusively measure digital engagement, lead or traffic acquisition, conversion, and retention along the prospect and customer journey. No human interaction occurs. If, on the other hand, your business model falls into the Low, Medium, High, or Very High LTV buckets, you will likely measure sales teams and their engagement steps as well as automated top of funnel steps.
Metrics are derived from data sensors instrumented into workflows. They either indicate healthy engine performance or alert you to overheating. Effective instrumentation is hard, detail-oriented work (which is why most startups don’t execute it well), but it’s important.
Build your metrics dashboard and financial plan based on unit economics. If you don’t, you’ll be driving blind and risking engine failure.
Other than fixed cost analyses, all metrics ultimately flow into unit economics. Two unit economics measures reveal a company’s financial health and viability:
- The ratio of an incremental unit’s lifetime gross profit (LTV) to its selling cost (CAC)
- The payback period on CAC
Payback is often expressed via the “magic number” calculation, which takes the growth in gross profit in the current quarter versus the previous quarter multiplied by 4, then divides that number by the marketing, sales and retention costs (CAC) of the prior period. If that calculation > 1, you have a payback period of under a year.
Investors generally seek LTV / CAC > 3, and a magic number > .75 or so. If a company outperforms, it should hit the gas. If (after the initial ramp-up and testing phase) it persistently underperforms, a company should hit the brakes, test and iterate with small teams and small budgets until performance rises above these thresholds.
The calculations of LTV and CAC differ by business model:
SaaS:
- LTV: gross profit per customer over the course of the average lifetime in a given cohort
- CAC: All marketing and sales costs divided by number of customers for that same cohort
Ecommerce:
- LTV: Gross profit per customer over the course of the average lifetime in a given cohort
- CAC: All marketing, traffic acquisition, and conversion optimization costs divided by number of customers for that same cohort
Peer to Peer Marketplace:
- LTV: Gross profit over the course of the lifetime per seller in a given cohort
- CAC: All marketing, traffic acquisition, and conversion optimization costs divided by number of newly acquired sellers for that same cohort
B2B2C Marketplace:
- LTV: Gross profit per business customer over the course of the average lifetime in a given cohort
- CAC: Marketing and sales costs to acquire the business customer plus marketing costs to acquire the consumer divided by the number of newly acquired business customers for that same cohort
Media:
- LTV: Gross profit per thousand impressions for a given cohort — i.e. monthly revenue minus any variable support costs (storage, etc.), divided by gross monthly impressions in thousands
- CAC: Marketing and sales costs to generate revenue plus traffic acquisition costs divided by gross impressions in thousands
Multiple factors drive LTV. Using historical data, you can calculate the LTV for the average customer, as follows:
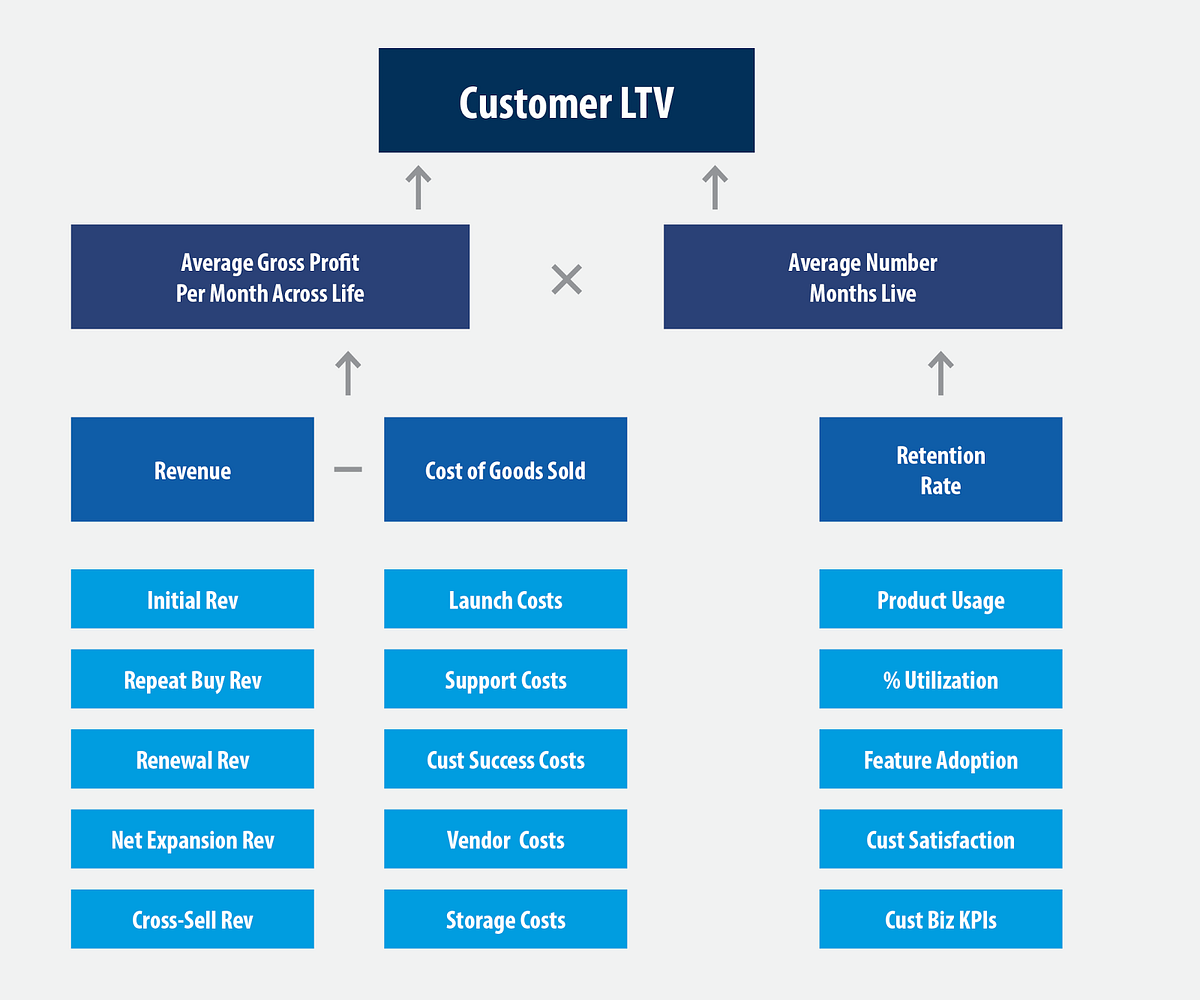
Depending on your business model, your metrics dashboard will track trends for:
Revenue:
- Average initial deal size
- Repeat purchases
- Upsells (expansion) in dollars
- Downsells (contraction) in dollars
- Cross-sells in dollars
Cost of Goods Sold:
- Launch cost per customer
- Support cost per customer
- Customer success cost per customer
- Product-related vendor costs per customer
- Storage costs per customer
Retention Rate:
- Product usage
- Percent of intended users utilizing
- Percent of features being used
- Level of reported customer satisfaction
- Customer’s business outcomes from using the product
Multiple factors also drive CAC. Using historical data you can determine the average cost to acquire a customer. For a B2B SaaS business, CAC is a measure of reach and conversion efficiency:
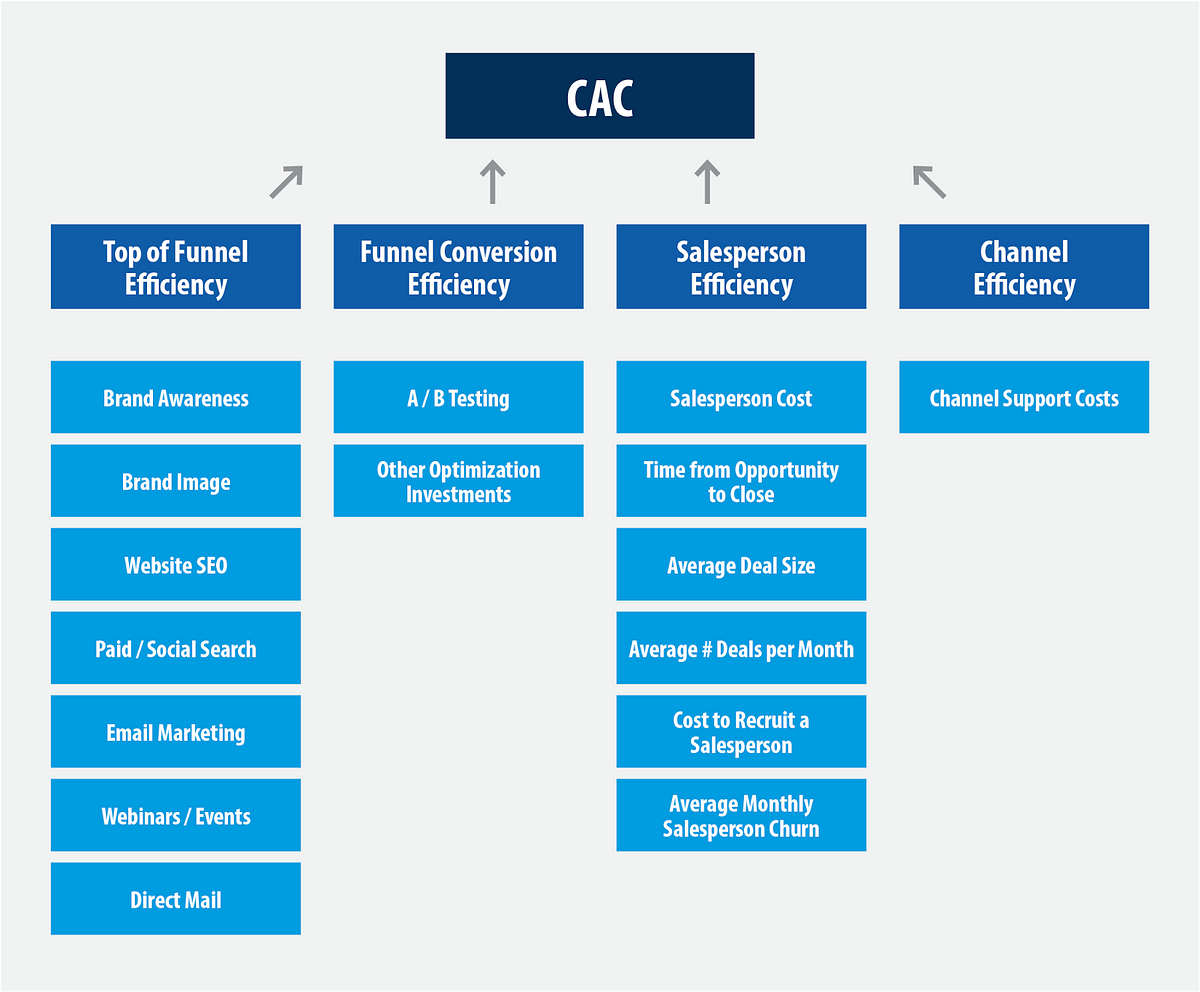
As with LTV, there are multiple contributors to CAC. At a high level, these are:
- Top of Funnel costs
- Mid and Bottom Funnel costs
- Channel costs
Your metrics dashboard tracks these CAC drivers so that you can continuously increase the efficiency of each dollar spent.
In pursuit of your growth goals, you may add:
- New segments
- New products
- New channels
- New marketing programs / campaigns
- New sales regions
- New salespeople
As you do so, tracking on all these dimensions is vital. Create a dashboard for each. Your metrics dashboard must tell you whether each new initiative has met the LTV / CAC and “magic number” hurdles. If a new initiative falls short, then test, iterate and optimize. Don’t give up too quickly — you may be just a couple of tweaks away from success. But neither should you hit the gas, at least until your optimization efforts yield the required performance outcomes. Once they do, of course, it’s pedal to the metal time.
Prospect Journey Metrics
Your metrics dashboard tracks performance along the prospect journey, from top of funnel, to mid, to bottom. It’s best to track by channel. If you have a Low to Mid LTV business model, your metrics dashboard might look as follows:
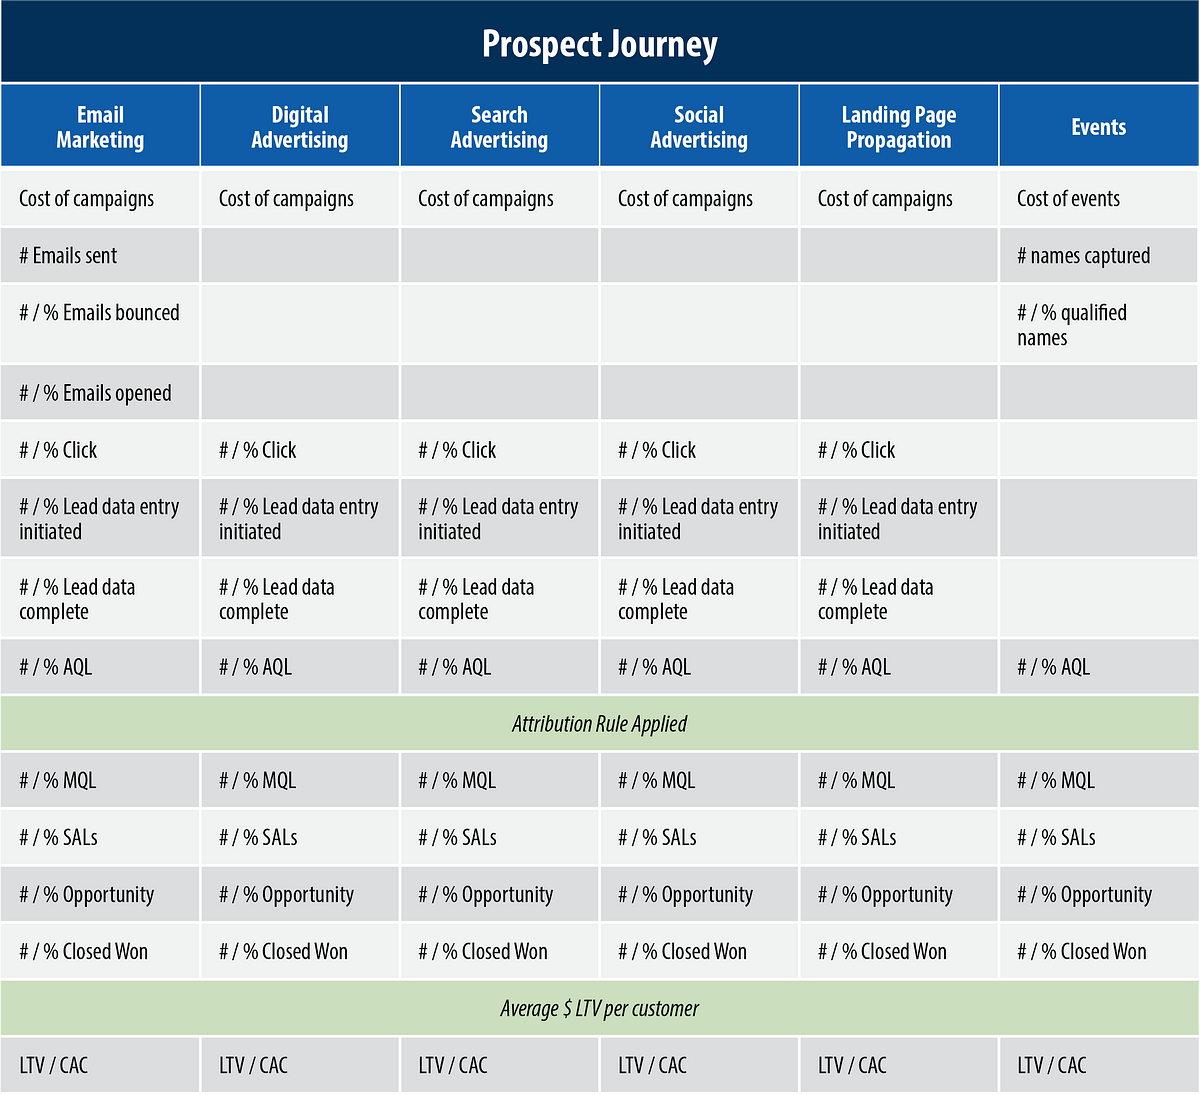
Be cautious with your attribution rules. Attribution of marketing touch points to a closed won deal runs the risk of false precision. If too much time has passed between the marketing touch point and the sale, the influence of the touch point is most likely low. This is especially problematic with High and Very High LTV business models, with their typically long sales cycles. Remember that the purpose of attribution is to establish correlation. You want to determine that a given marketing input yields a predictable sales outcome. If there’s an easier path to correlation, take it. It may be best to just A/B test or time series test the yield from one step to the next — i.e. from an inquiry to a lead or a lead to an SAL — than to focus excessively on attribution of closed won deals.
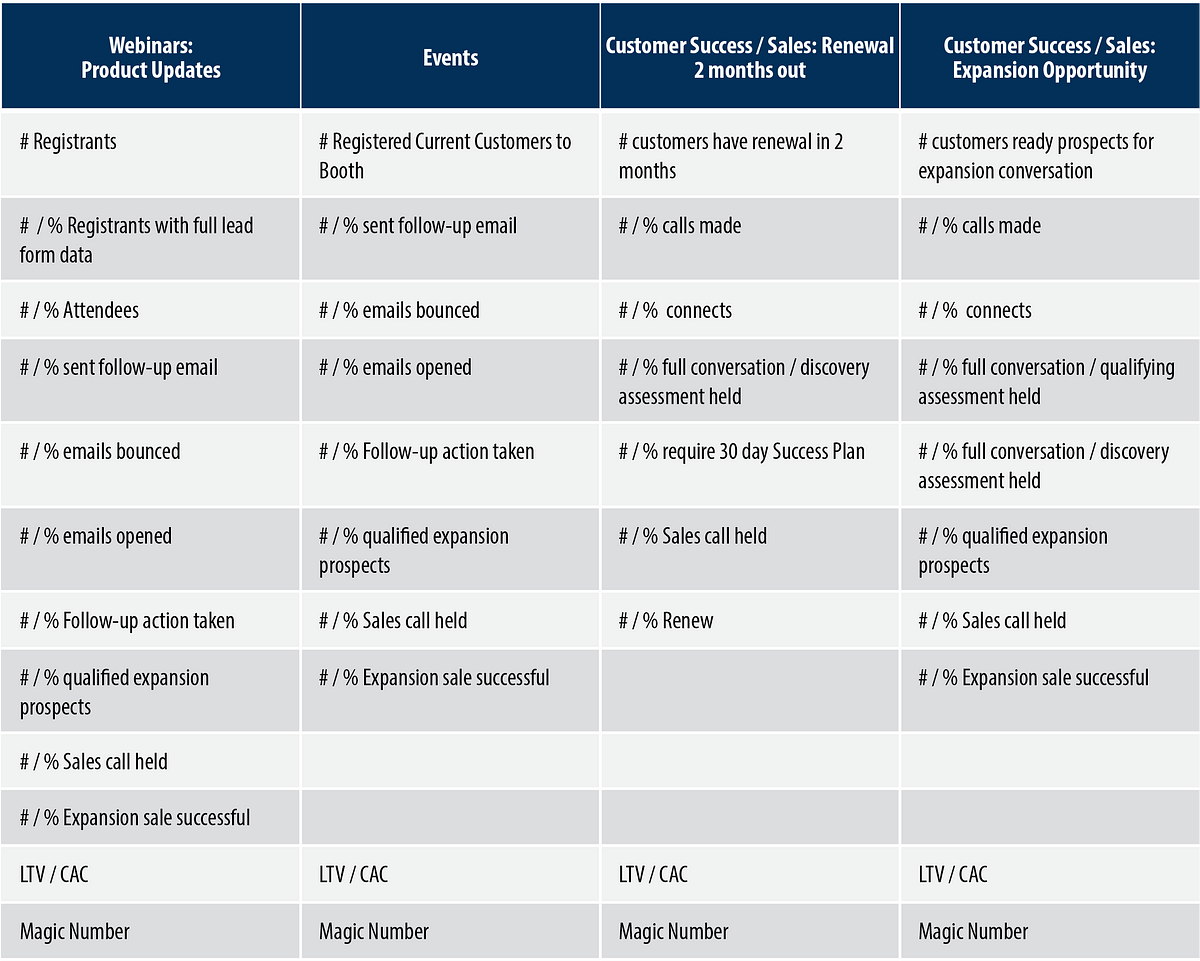
Customer Program Metrics
Net new expansion revenues and LTV can be tracked based on various programs:
Channel Metrics
The effectiveness of channel partnerships can also be measured through the lens of unit economics:
Revenue share partnerships:
- If your partner books gross revenue and you receive net revenue, your LTV will be lower than direct selling, but your CAC will be small — possibly zero: usually a net positive, all else being equal
Traffic or lead acquisition partnerships:
- If the incremental traffic or lead volume is predictable and the value of traffic in LTV yield is clear, then the investment in the acquisition can be measured in LTV / CAC and Magic Number terms and judged accordingly
- If the investment is fixed and traffic or lead volume potential is less predictable, there is increased risk that the investment will fall short of the LTV / CAC or Magic Number threshold
And of course, once a channel partnership is in place, a metrics dashboard to track partnership performance should be implemented and regularly reviewed with your partner.
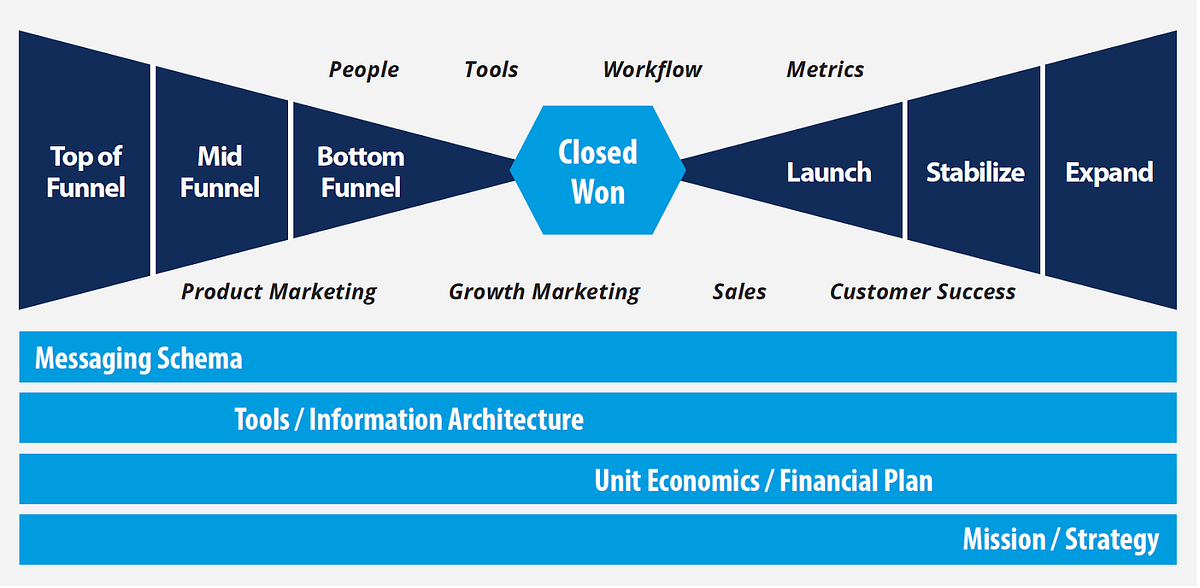
Company-wide Unit Metrics Dashboard
The result of building unit economics into everything is a metrics dashboard hierarchy that looks something like this:
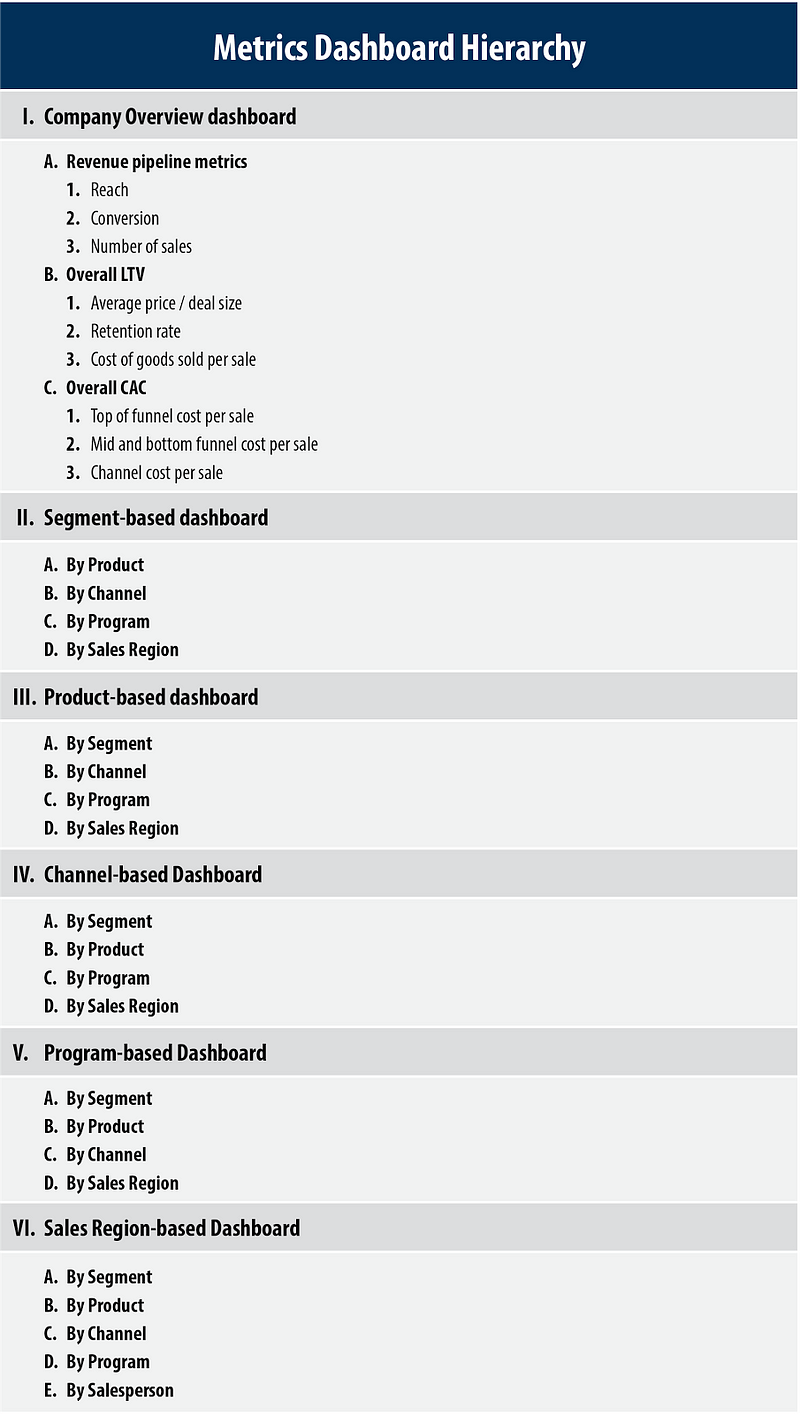
Looking at the same data from multiple angles heightens clarity. Marketing, sales, customer success, the product team, and the exec team can use these dashboards to continuously optimize profitability and growth.
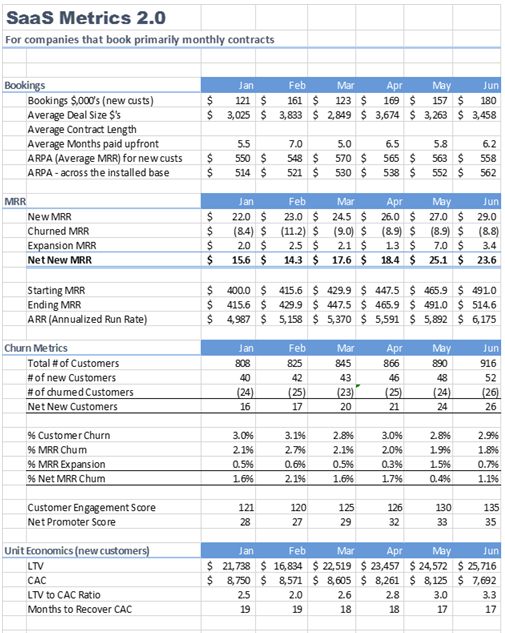
Metrics dashboard design is important. If you’re a SaaS business serious about creating a metrics-driven company, David Skok’s SaaS Metrics 2.0¹ is a must read.
It’s the most comprehensive, well-researched blog out there on unit economics and metrics infrastructure for a SaaS based company. In fact, it’s so good it’s worth reading no matter what your business model is.
Check out this company overview dashboard from Skok’s blog. It highlights key drivers of unit economics for a SaaS business:
Brandon Christie, currently head of product monetization at Captora and formerly an analyst at the VC firm NEA, is an expert at trend visualization. Here’s a cohort analysis he created:²
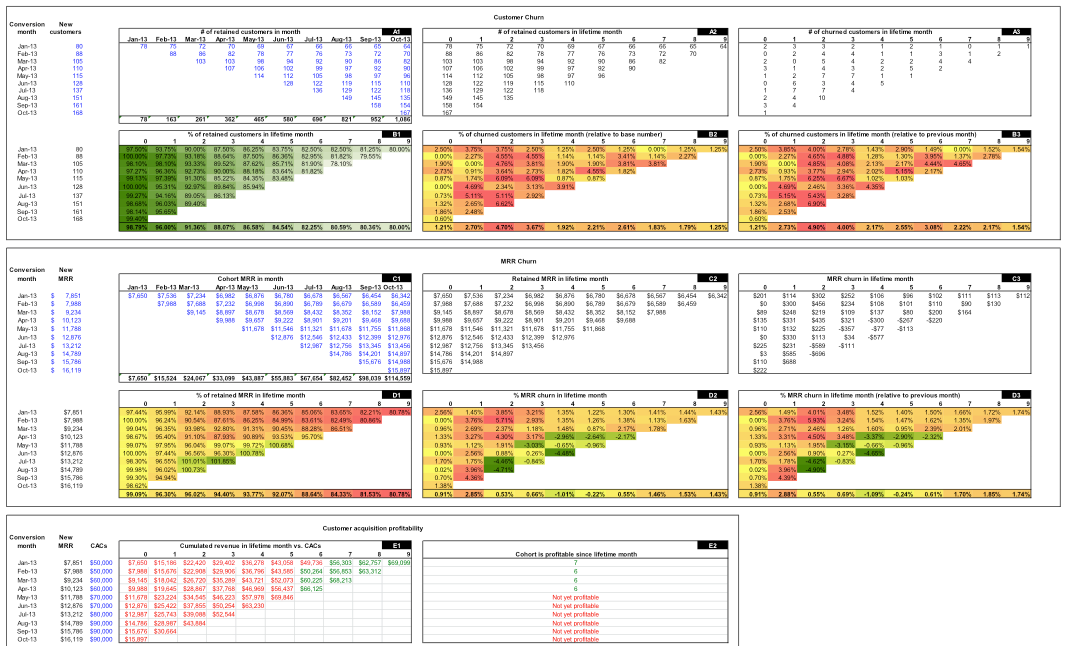
It gives you a sense for the metrics infrastructure you must build to run a fit and trim revenue engine.
Measure on.
To view all chapters go here.
Notes:
1. David Skok. “Sales Metrics 2.0 — A Guide to Measuring and Improving What Matters.” Blog post. forEntrepreneurs.com. n.d.
2. Provided by Paul Albright, CEO of Captora.
If you would like more CEO insights into scaling your revenue engine and building a high-growth tech company, please visit us at CEOQuest.com, and follow us on LinkedIn, Twitter, Facebook, and YouTube.