Financial plans face facts and forecast accordingly.

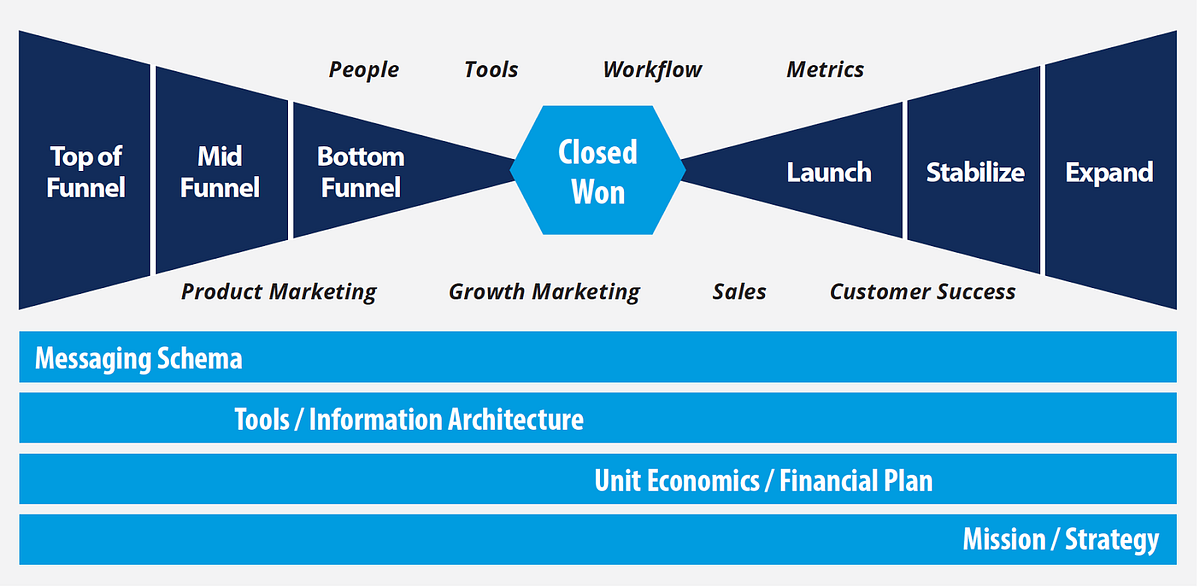
The financial plan is part of the Unit Economics / Financial Plan foundational layer in the Bow Tie schema.
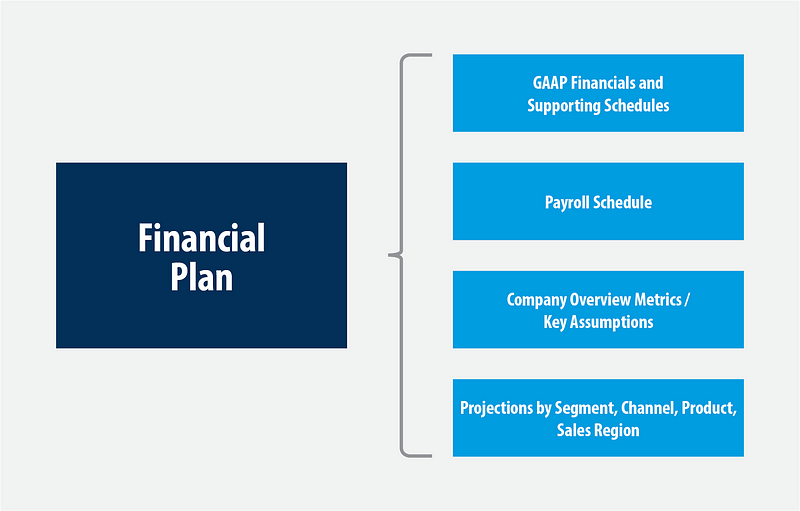
It exists for several significant purposes:
- To deliver GAAP financials to investors for auditing
- To provide investors sound and supported growth and profitability projections
- To plan sources and uses of cash to assure company viability
- To compare projections to actuals
- To present monthly company overview metrics
- To constitute a “single source of truth” — all metrics dashboards are reconciled to it and sit under it
- To confirm the viability of planned investments based on reasonable assumptions
- To evaluate the business by employee, by segment, by channel, by product, by marketing program, and by sales type and region
The model is built via inputs:

It yields a set of outputs:
And it links to a set of systems:

Your challenge is to ensure the data inputs, system linkages, and final outputs are executed to deliver to key stakeholders (your exec team, your board and current investors, and potential future investors) the maximum value while requiring the minimum effort to complete. This takes smart planning and careful implementation if you want to avoid a highly inefficient, continuous mess.
Top-Down vs. Bottom-Up
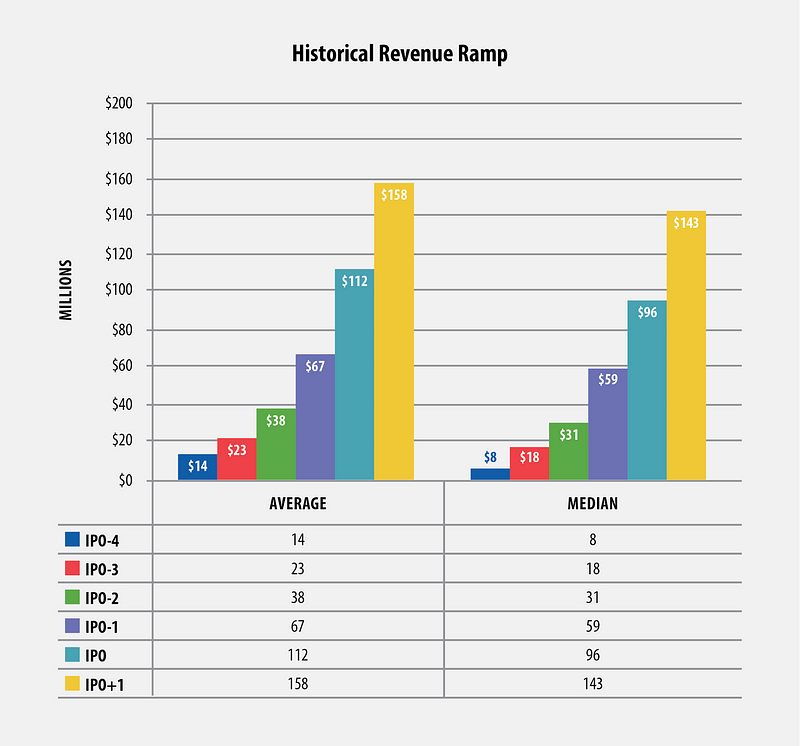
Your financial plan will model projections over a 2–3 year period. These projections are sure to be “up and to the right.” But at what clip? A top-down look will draw comparisons from successful companies with similar business models to yours. For instance, if you are a SaaS business you look at the early performance of public SaaS companies:

Brian Royston, a serial CFO in Silicon Valley, conducted the following 2015 analysis of public SaaS companies’ early year performance. These comparisons can give you a rational “top-down” picture of revenue growth rates, gross margins, and other key financial projections.

But as your financial model builds top-down from these numbers, it’s important to work bottom-up as well. This is a key sanity check. How many sales reps are required? Is it reasonable to hire these reps as quickly as the model stipulates? Have you factored in salesperson churn? What assumptions about the average deal size and deals per month are implied? To achieve this, what marketing spend is required, yielding what quantity of MQLs per month? Are the implied conversion rates reasonable? Is the marketing budget sufficient to drive the required number of leads?
A bottom-up model forces you to think through the dependencies between your investments in marketing, sales and customer success, and the outcomes regarding revenue and churn. You must conduct a reasonableness test of projections vs. your current reality. If there is a significant improvement in key metrics implied in your projections, what initiatives have you mobilized to achieve these improvements? Are the projected outcomes reasonable? Have the costs of these initiatives been built into the model?
By working both top-down and bottom-up, projecting into the future while reviewing the past and current performance, you vector towards a reasonable and defensible financial plan.
But a financial plan is not just about projections. A well-designed financial plan presents both plan and actual, after every month’s close. The variances between the plan and actuals are alerts that focus exec team attention and drive continuous improvement. There are four building blocks to ensure the efficient comparison of plan and actual:
- Defined customer hierarchy
- Customer unique identifiers
- Customer detailed transaction report
- Pivot tables
Defined Customer Hierarchy
What is the hierarchy of your customer data? Is your customer General Electric? Or is it the Marketing Department of the San Francisco Region of General Electric? You must determine the most atomic level of “customer” you will support, then build the parent / child scaffolding above it. It is vital to structure your data this way, so that reporting is clean and you are able to compare “apples to apples.”
Customer Unique Identifiers
With a clear customer hierarchy in place, you are ready to develop a unique identifier protocol to tag customers. It’s important that these unique identifiers are maintained as you hand customer data from system to system. By doing so, your CRM, Contract, Accounting, Billing, and Customer Success systems will be in alignment with the Financial Model. This ensures one source of truth.
This is hard, granular work. For each data element in a customer record, you will need to determine which system is the master and which systems are subordinate. But if you think it through carefully and implement it rigorously, you will build a solid foundation for scaling.
Customer Detailed Transaction Report
From the initial contract through every status change along the customer lifecycle, you need to capture the data in the customer record and log the history. This requires a Customer Detailed Transaction Report.
Here is what such a report looks like:

In this example, for a SaaS company, the columns include:
- Customer name
- Effective date
- Term start date
- Term end date
- Termination for convenience date
- Cancellation date
- Canceled before recognizing revenue? Y/N
- Booking amount canceled
- Billing amount canceled
- ARR canceled
- Renewal ARR increase / decrease
- Deal type
- Total contract value
- Booking amount
- Term (in months)
- ARR
- Auto renew Y/N
- Billing frequency
Ideally, from the date of company inception all the way through to current day, every single customer’s entire history, including all changes in their status at the most atomic detail level, is tracked and reportable. This gives you incredible analytical capability.
Furthermore, when you seek new funding, or you move towards an M&A transaction, the data will streamline due diligence and convey credibility.
Pivot Tables
Since the underlying data sets that make up your financial plan are large, you may wish to use pivot tables so as to summarize data into a few data fields quickly and easily. You can efficiently create multiple reports that draw upon the same data sets.
Summary
The financial plan and underlying metrics dashboards comprise the central nervous system of your business. They reveal the strengths and the failure points, and track progress over time. They give you forewarning of a cash crunch. They force you to think through the implications of your plans regarding expense and revenue, investments and cash, and new headcount and productivity outcome timing. They enable you to articulate your case for funding to investors.
As such, the financial plan is a critical component of the revenue engine. To make your engine a Porsche, a well-conceived and well-maintained financial plan is key.
Plan accordingly.
. . .
If you would like more CEO insights into scaling your revenue engine and building a high-growth tech company, please visit us at CEOQuest.com, and follow us on LinkedIn, Twitter, Facebook, and YouTube.